
Screen a transaction once. Value and report it on your cadence.
Ikenga helps investors, developers and asset owners screen a new transaction, then value and report the same asset — and the portfolio it builds into — on your cadence, to owner, investor, community and grid, at the grid node that determines its value. BESS, solar, wind and hybrid.
We value the node and the asset, not just the asset.
An asset only delivers value through the substation it connects to — that node is what lets value flow to the grid, to the communities it serves, and to the balance sheet. So we score the node, then value what the asset can flow through it — to four stakeholders at once. Compliance houses score the asset's ESG; valuation firms mark the equity. We do both, at the point on the network where value is created or lost.
Owner
Project-level fair value — the return the asset generates on its own economics.
Investor
Fund- and LP-level view — levered returns, portfolio diversification, and the numbers that hold up in due diligence.
Community
Local welfare the asset unlocks — reliability, air quality, jobs and energy access at the connected node.
Grid
System value delivered to the DSO and TSO — congestion relief, flexibility and ancillary services.
Three decisions — one at the transaction, two every period.
Should we pursue this — before spending on full DD?
Investor Quick-DD and benchmarking, for investors and developers. Screen a BESS, solar, wind or hybrid project against its grid node and its market — advance the ones worth diligence, drop the ones that aren't.
See a worked screen →What is it worth — and will we finance it, at what price?
Underwriting and valuation analysis, for investors and lenders. Independent IFRS 13 / ASC 820 / IPEV Level-3 fair value to owner, investor, community and grid, reproducible to the substation — the number that holds up in due diligence, and the mark you refresh every quarter and at year-end.
Explore Analytics →What must we disclose — and can we demonstrate it?
Asset-level evidence for fund and regulatory reporting, for asset owners and fund managers. CSRD/ESRS, EU Taxonomy, SFDR and AIFMD II — computed from curated public data that any auditor can follow to source, and reproduced every reporting period as the rules and the asset move.
Explore ESG →Three outcomes, one engine.
Screen, Value and Evidence all run on a single methodology. We score the grid node the asset connects to, value what flows through it to four stakeholders, and produce the regulatory evidence — with systemic research as the R&D behind it.
Grid-node score
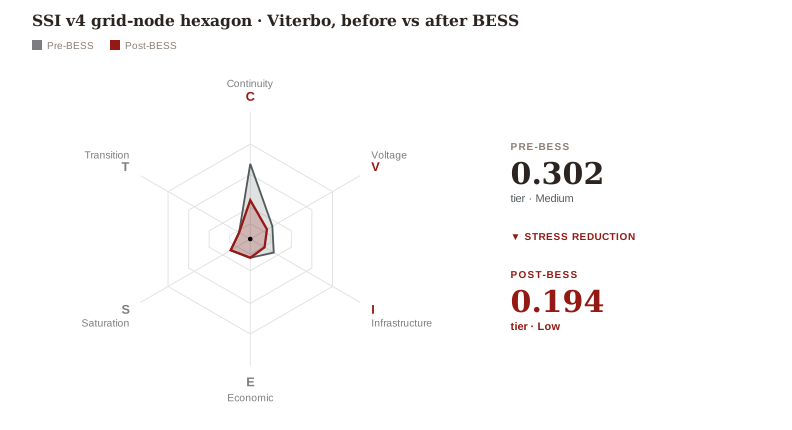
The SSI Index — how stressed the substation is, before and after the asset.
SSI Index →Level-3 valuation
IFRS 13 / ASC 820 / IPEV fair value to owner, investor, community and grid.
Analytics →Systemic research
Cascade & compound-risk research — the R&D behind the engine.
Systemic Risk & Resilience →One asset, end-to-end.
Follow a single Italian battery — Salento BESS, 50 MW / 200 MWh in the SUD (Puglia) zone — through the whole platform: its grid-node SSI score, its Level-3 fair value to all four stakeholders, and its regulatory disclosures, at both asset and portfolio level. An illustrative asset, built on the real methodology.
Genuine outputs of the engine — figures redacted, methodology intact.
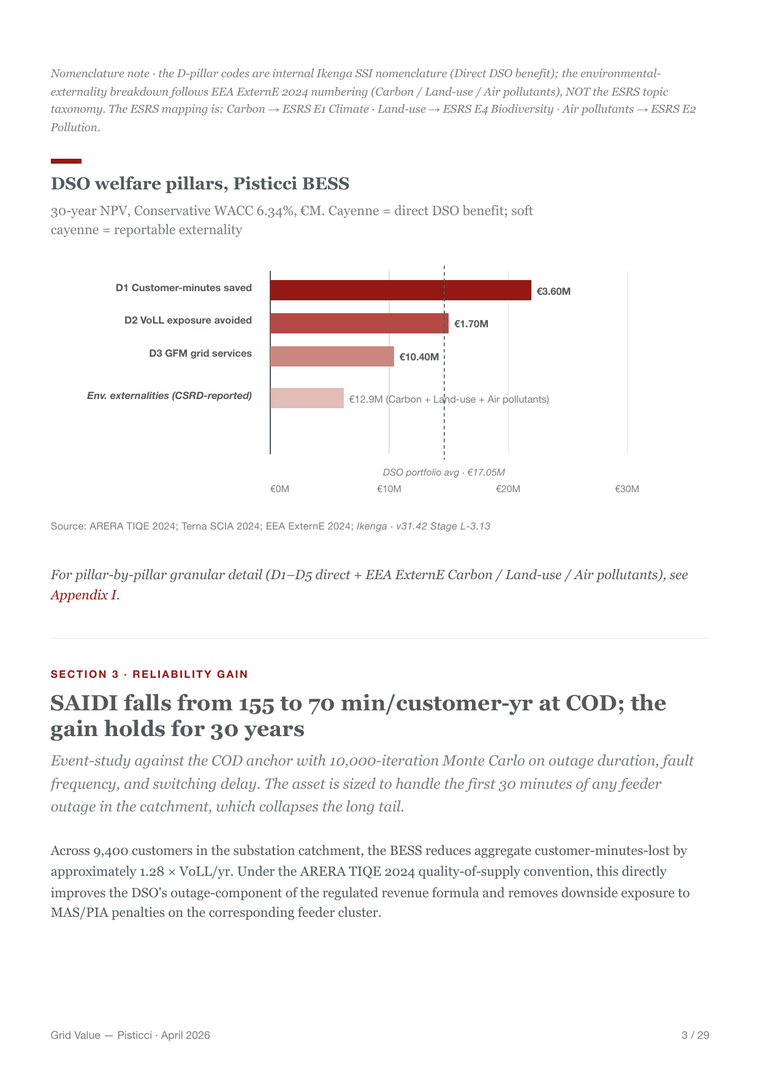
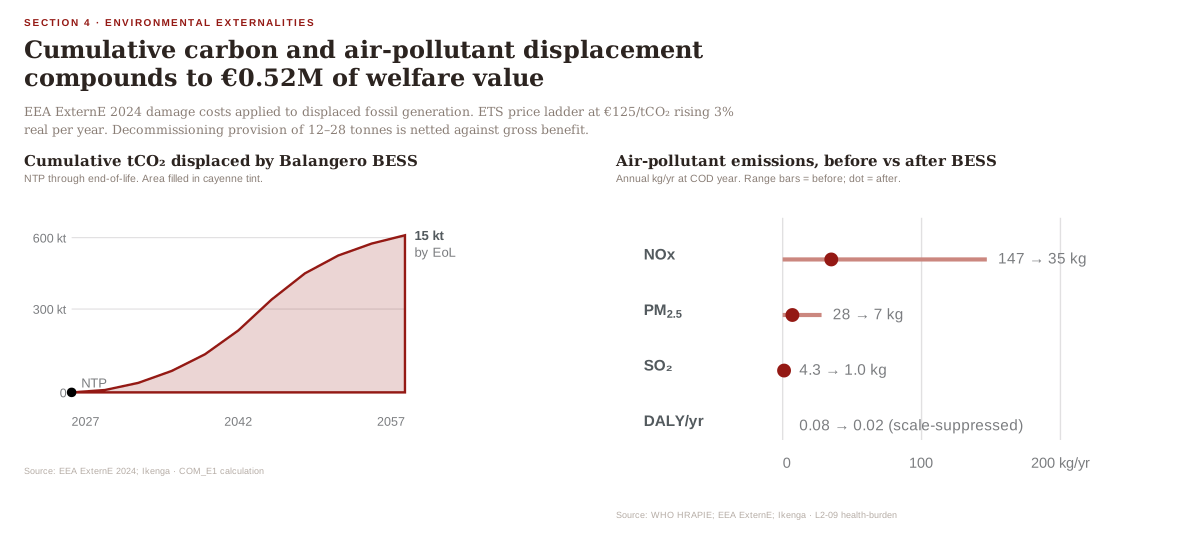
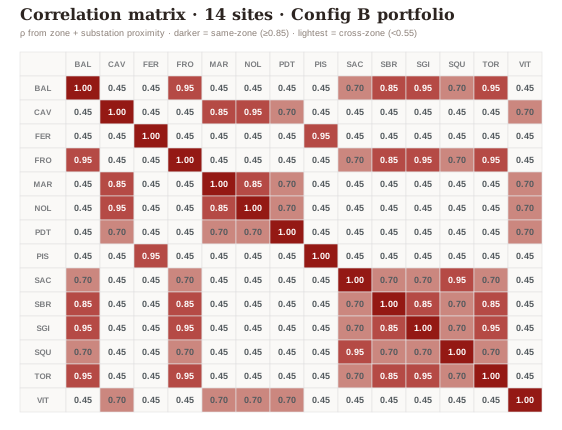
Every figure is rendered by the platform and traces to a curated public source. Four views from two Italian demo portfolios — Config B (14-site) and Config C (bespoke). Illustrative figures on Ikenga's own methodology portfolios.
Standards we build against.
See a sample, or commission a mandate.
Request a redacted sample compliance or valuation report, or commission a systemic-risk study on your own assets.